Platform · Metrale Economics
Every GPU. Every workload. Every dollar.
Metrale Economics turns runtime telemetry into enterprise economic accountability across private and cloud GPU fleets. The industry measures inference in tokens per second. Enterprises pay for it in dollars per workload. This is the layer connecting the two.
Who this is forCFOs, FinOps and platform leaders who have to explain an inference bill, and the operators who want the budget conversation to be about numbers they can stand behind.
In the console
The economics view. Cost per million tokens, chargeback by business unit and the payback clock.
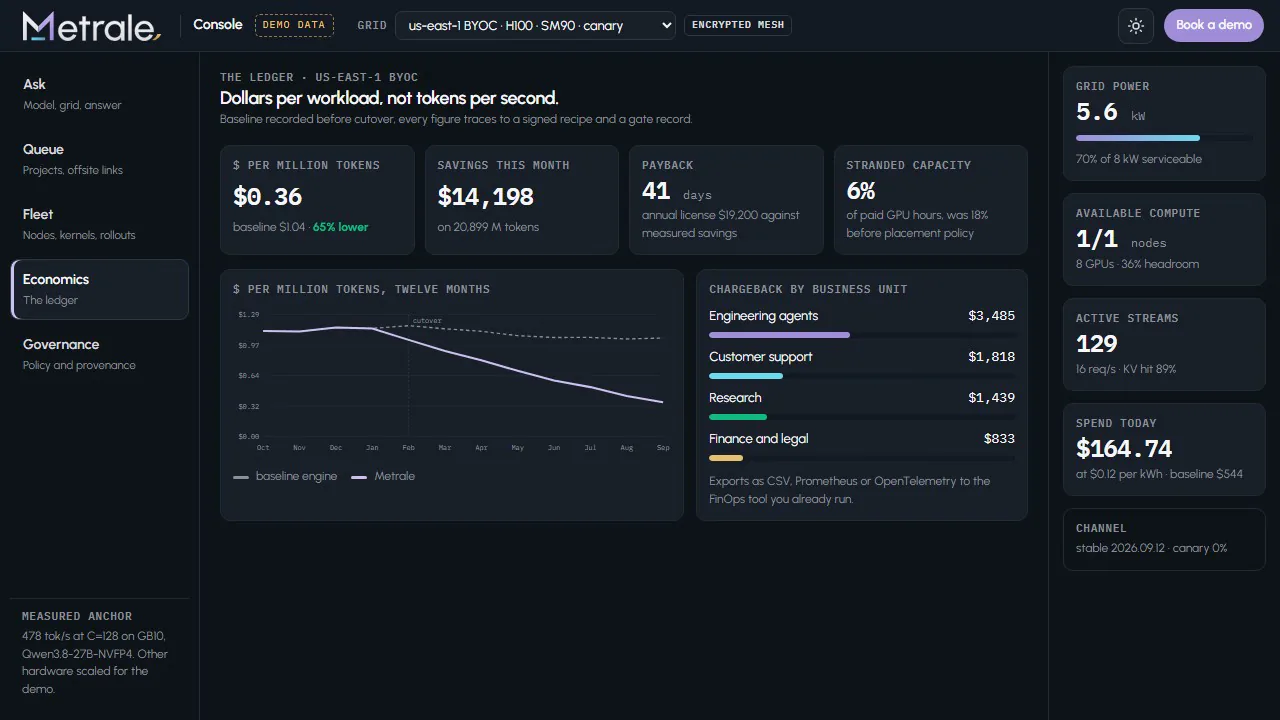
Metrale Console. Demo data, recorded from the product mockup.
What the ledger joins
Operator telemetry
- TTFT and TPOT
- Tokens per second
- Queue depth
- KV cache hit rate
- GPU utilization
Economic accountability
- Dollars per million tokens
- Dollars per successful workload at SLO
- Productive GPU hours
- Stranded capacity
- Cost by model, cluster and business unit
- Savings against the production baseline
Correlation layer
Workload × model × runtime × configuration × GPU × cluster. Tie each unit of work to the infrastructure and configuration that produced it.
What it does
Baseline first
Before a single request moves, Economics records what each cluster costs per workload today. Every later number is a delta against that receipt, not a vendor estimate.
Chargeback by business unit
Cost attributed to the team, the application and the model that consumed it. Exportable to your FinOps tooling as CSV, Prometheus or OpenTelemetry.
Stranded capacity
GPU hours that were paid for and produced nothing, by cluster and by hour, so idle capacity becomes a scheduling decision instead of a surprise.
Power and cooling
Watts, PUE and tariff per site, so cost per million tokens includes the electricity and the savings include the kilowatt hours you no longer burn.
The payback clock
License cost against measured savings, recomputed monthly from production data. The number the decision maker walks to the CFO with.
Provenance on every figure
Every cost line traces to the signed recipe, kernel build and gate record that produced the tokens. Finance can audit it, not just read it.
The arithmetic
Two numbers, and everything on this page derives from them.
Proposed. From the platform architecture brief, September 2026. The ladder is measured. These are the definitions the platform is being built to report, and each one is computed for your baseline the same way.
Inference efficiency
Useful generated tokens divided by allocated GPU seconds. Useful means tokens a caller received, not tokens a batch produced and threw away.
Cost per million output tokens
GPU, storage, network and platform cost, divided by output tokens in millions. The baseline you ran before is computed the same way, so the difference is honest.
Tokens per joule
Tokens delivered per joule the box drew, from the power telemetry beside the GPU counters. The third payback tab on the pricing page counts in it.
Cache savings
Prompt tokens served from the prefix cache instead of recomputed, counted and priced. A fleet of agents sharing a context bus lives on this number.
Idle cost
Allocated GPU seconds that produced nothing, priced at what they cost, by cluster and business unit. Stranded capacity gets a dollar figure.
Revenue per GPU hour
For a fleet that sells capacity, what an hour of a GPU earned against what it cost, and what the idle hours could have earned.
The operator view
Capacity you are not using has a price. So does capacity you are.
Proposed. What the platform is being built to show a fleet operator and a finance team, from the same telemetry the bill is drawn from.
Nothing billed that you cannot see
A license counts a cluster or a number of GPUs, and the console shows that count live, from discovery, not from a spreadsheet. A renewal is read off the same number.
The hours you are not using
Idle capacity is shown as what it costs and what it could earn. An operator sees the peak, the average and the trough of every pool, and the licensed share against the whole.
Opt in, rent out
A fleet that chooses to can offer its idle GPUs for secure, decentralized inference, priced dynamically and metered from the moment they are switched on, and keep the earnings against its own utilization problem.
Live telemetry, not reported metrics
The engine reports what it did per token and per joule. Numbers added by operators and gateways are kept apart, so the ledger never confuses a measurement with an estimate.
One ledger, three readers
The engineer, the finance operator and the auditor read the same record: which GPU, which model, which business unit, at what cost.
A baseline you ran
Every delta is against a congruent baseline on the same GPU, the watts and the tokens per second measured the same way, so the saving is a receipt.
modeled payback on a 256 GPU fleet at a 1.20x uplift, defaults shown on the pricing page
modeled savings replacing a metered API with owned boxes at measured throughput
ledger dimensions per unit of work
baseline per cluster, recorded before traffic moves
Questions
The questions we actually get asked.
Short answers. Each one is backed by something on this site or in the repository.
How is it priced?
Per GPU per year for the Enterprise Edition, with volume tiers as the fleet grows, and a per box license for workstation and edge deployments. Support and forward deployed engineering are priced separately. The Community Edition is free under AGPL-3.0. The pricing page lists the proposed sheet and a payback model with editable inputs.
How do you measure savings?
Against your own baseline. Economics records what each cluster cost per workload before Metrale takes traffic, then reports the delta as traffic moves. The pilot ends with a receipt in dollars per million tokens and dollars per successful workload, not a slide.
What is the payback period?
It depends on your fleet, your utilization and the uplift we measure on your workload. The model on the pricing page computes it from inputs you control. Every month after payback is upside, which is why we talk about payback rather than a percentage.
What about SOC 2 and compliance?
The architecture is built for regulated buyers, and SOC 2 readiness documentation, model risk documentation and pinned recipe governance packs are part of the first SLA engagements. Ask for the current state of the audit program when you book. We will tell you exactly where it is.
What support comes with it?
Community support in Discord for the open source engine. Enterprise includes a named engineer, a response SLA and a shared channel. Forward deployed engineering for the pilot and the cutover is scoped per engagement and credited against the first year on conversion.
Ask the rest in a working session, or read the deployment guide ↗.
Next step
See it against your own workload.
A side by side ladder on your hardware in week one. Your models, your criteria, your receipt.